


In September 2023 Elenia installed a new electric meter in our house. This new electric meter is from the company Aidon and it comes with a HAN port (Home Area Network). When the meter gets installed the HAN port is inactive. It requires a Mail to Elenia’s customer support to get it activated.
Reading data from the HAN port
When I found out about the possibility to read data from the meter I immediately thought of an ESP8266 and after some search I found several projects across Europe which have successfully, in a DIY open-source manner, published and created projects around the HAN P1 port. P1 means that data can only be obtained, there is no talking back to the meter.
Since we are living in Finland I was sure that a fellow Fin would have created something – and yes there was one. Jonni Rainisto, who runs a Blogspot blog, had a ready solution for Elenia’s Aidon meter. I bought his product via Huuto for 25 € + postage. Two days later it arrived at our door step. It is a WEMOS D1, a custom PCB with two resistors, an NPN transistor, the RJ12 connector and the socket for the WEMOS, and of course a cable and a 3d printed case. The case could probably need an extra millimetre. But all in all well made! I highly recommend it!
It took me some time to go through his instruction manual. It is pretty extensive and everything is very well explained. I’m new to ESPHome since I usually code my IOT sensors on my own. But no worries. After some tinkering and trying different code repositories I got it running.
Now it was time to bring it all together in Home-Assistant
Some months ago I configured the ABB inverter plugin in Home-Assistant and got all the info about the produced solar energy. The plugin works very well and gives a lot of insights into the inverter.
After I got the reader working I imported a energy dashboard in Home-Assistant for the HAN data.
In order to actually attach a price to kWh consumed (or produced) I went to https://transparency.entsoe.eu, obtained an API key and integrated it into Home-Assistant.
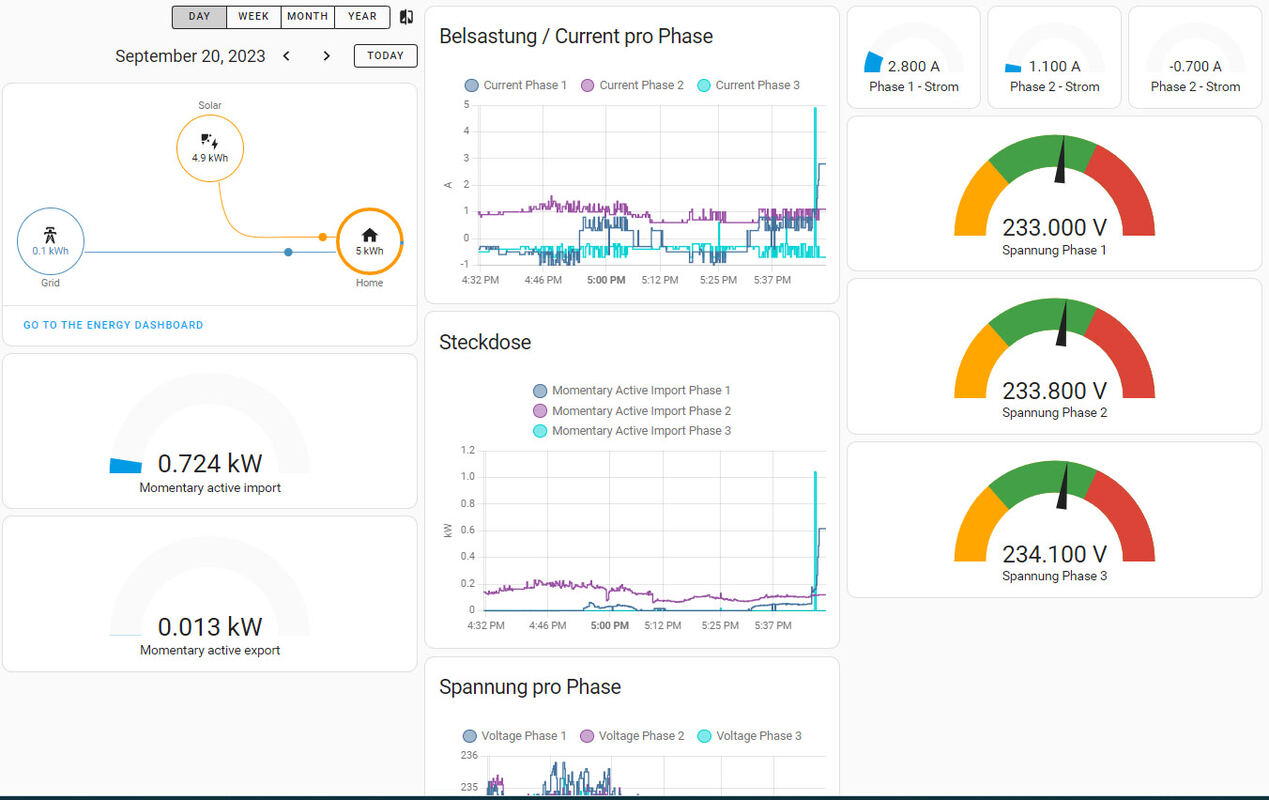
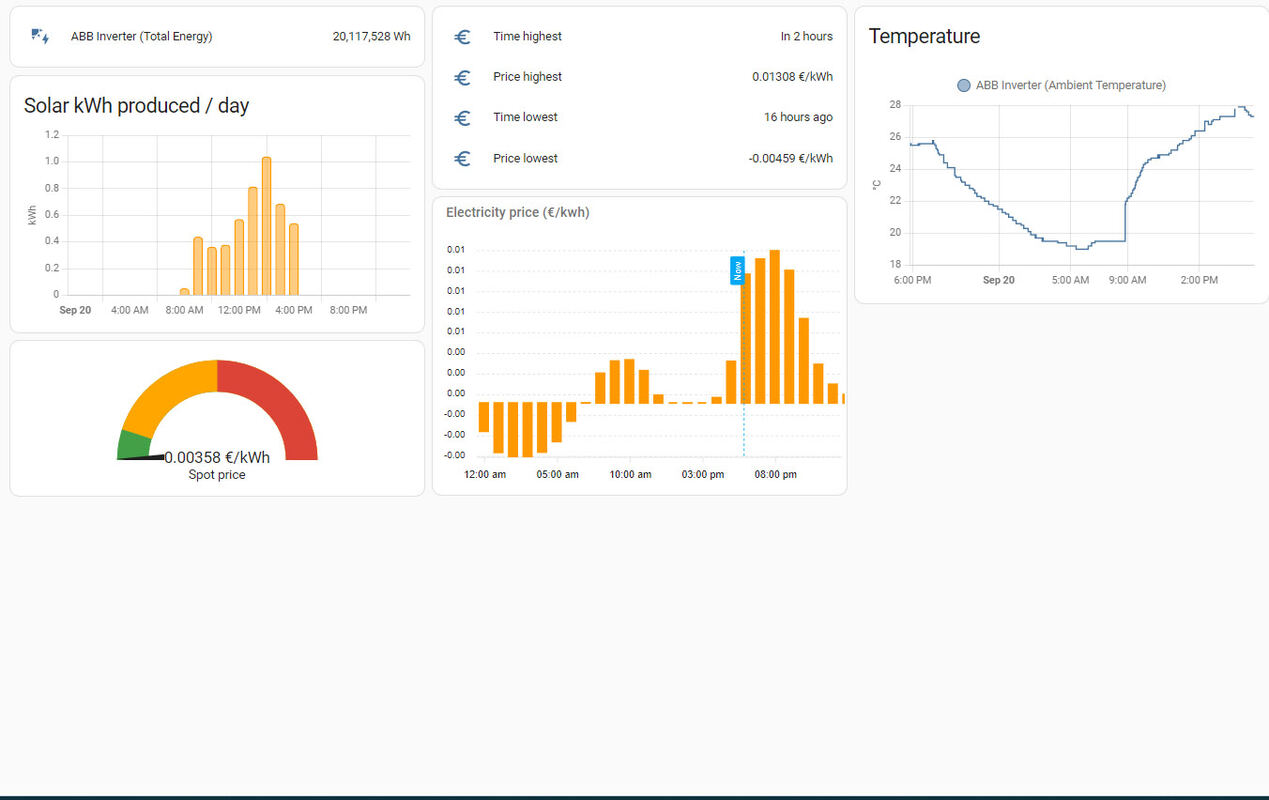
From that dashboard I can see how much energy is im- and exported (solar panels). The spot market data from Entsoe give me an idea about when energy is cheap (lots of wind) or when it is expensive. Spot market prices for the next day are always released at 15 o’clock, hence Entsoe data will give me an idea about the highest and lowest price within the next 24 hours.
For the future
I’m now finally able to see energy consumption and production and I can think about where I can lower consumption and / or increase production. An increase might be possible adding more solar panels. The ABB inverter can handle a second array of panels. I have some extra panels around which I could mount on the south-west facing wall (just an idea). They will constantly be free of snow and hopefully can capture the low winter sun. In total I can probably add some additional 1,6 kWh, maybe even 2 kWh. But this is it for this story.